
Our site archives all of Donald Trump's TRUTH Social posts, providing a searchable index of his statements, video transcripts, and image descriptions.
Menu
Our site archives all of Donald Trump's TRUTH Social posts, providing a searchable index of his statements, video transcripts, and image descriptions.

Truth Details

  Information

Original Post Date
Capture Date
TRUTH Social status ID 117661238960252261
Original URL https://truthsocial.com/@realDonaldTrump/117661238960252261

  File Attachments

Image Description:
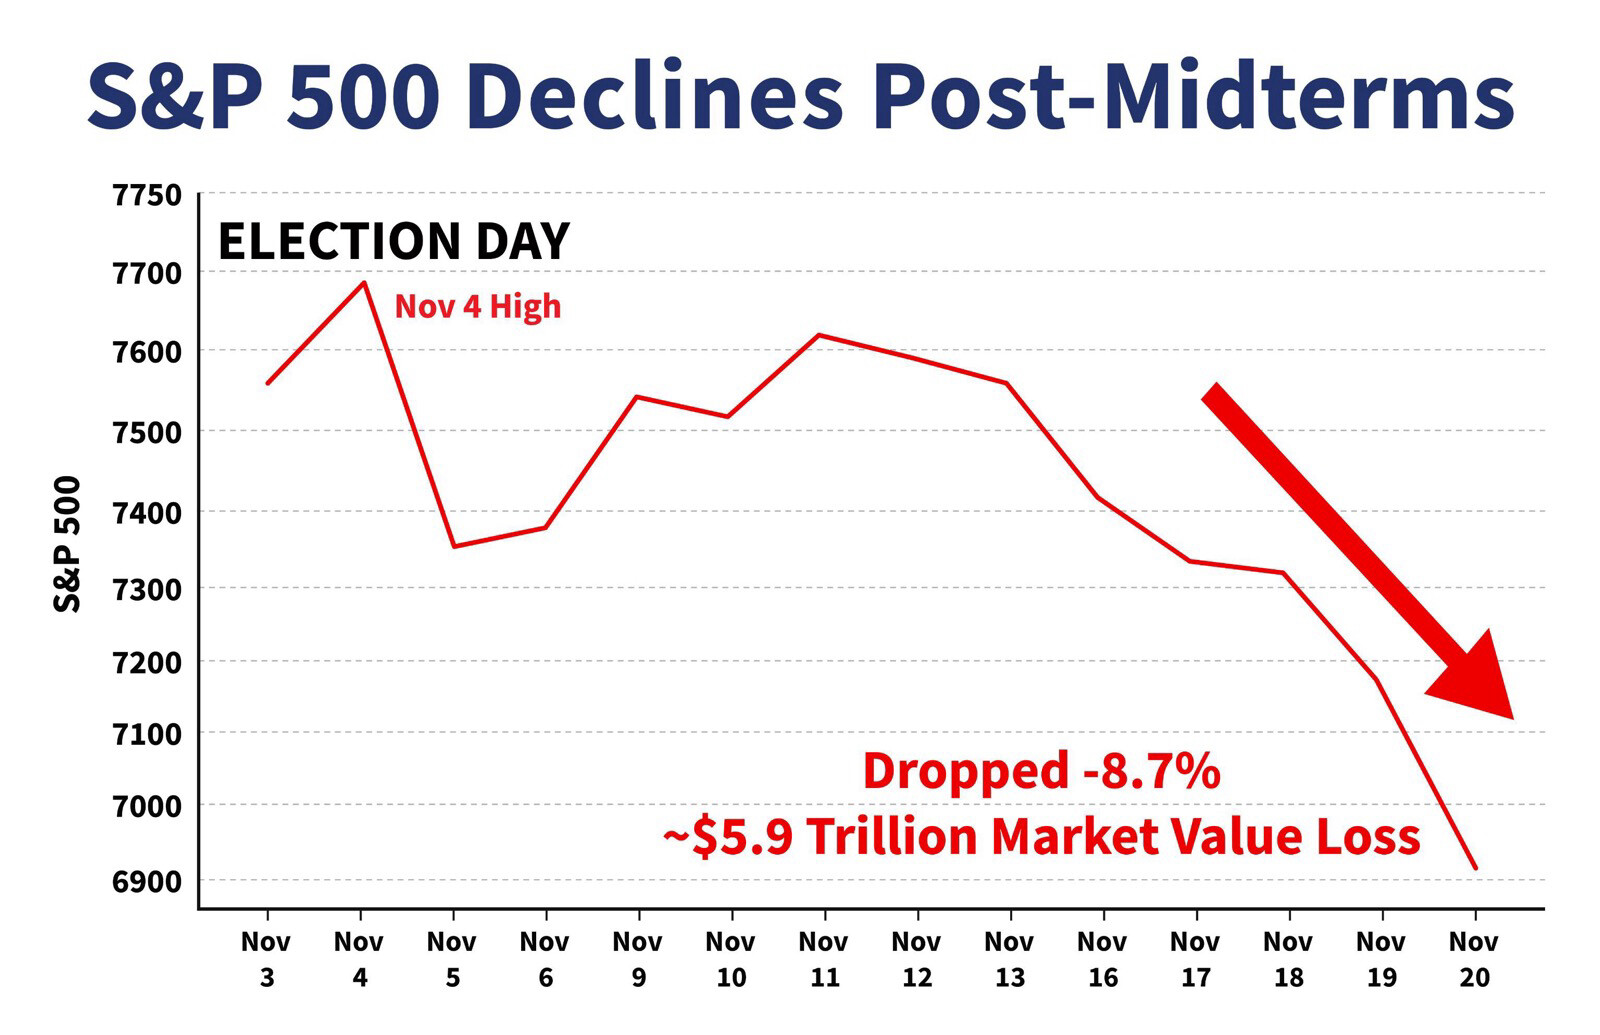
A line graph titled "S&P 500 Declines Post-Midterms" shows the S&P 500 index values from November 3 to November 20. The graph marks a high point on November 4 labeled "Nov 4 High" and indicates "ELECTION DAY." The line descends from mid-November to November 20, highlighting a drop of -8.7% and a market value loss of approximately $5.9 trillion. The x-axis is labeled with dates in November, and the y-axis shows S&P 500 values ranging from 6900 to 7750.