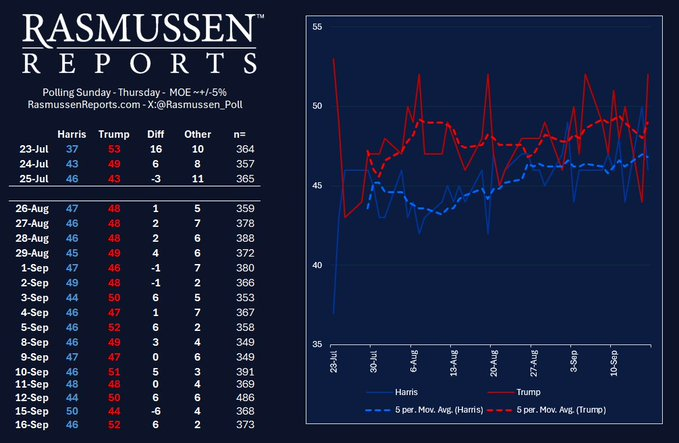
Rasmussen Reports poll data showing daily survey results for Harris and Trump from July 23 to September 16. Table on the left displays individual percentages for Harris, Trump, and Others, differences between Harris and Trump, and sample sizes ('n'). The line chart on the right visualizes the performance trend of each candidate over time with a 5-period moving average for both Harris (blue line) and Trump (red line). The data suggests fluctuating support for both candidates throughout the observed period.